


.jpg) High Security Locks What do you keep in your aircraft? $1000 headsets? $2000 Handheld GPS Units? Protect them, with Medeco Locks. Toss the worthless locks you have on your aircraft now. Shop Now »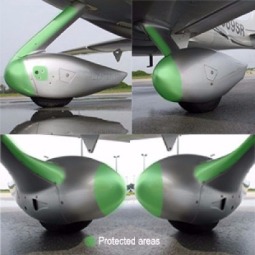 Paint Protection Film Protect the paint on your aircraft. This paint protection film is a direct for what manufacturers use. Shop Now »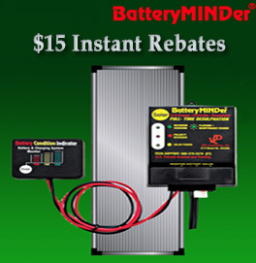 Prolong Battery Life Tired of replacing your aircraft battery every 18 months? Can't fly as often as you like to ensure battery life? You need a BatterMINDer. 12V, 14V or 24V. Shop Now »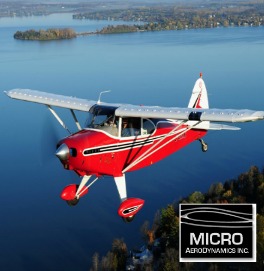 Vortex Generators
MicroAero produces the best Micro VGs on the market today. Improve take offs, nearly
eliminate Vmc, improve safety and more.
Shop Now » 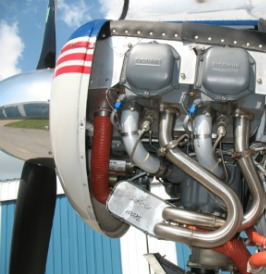 Power Flow Exhaust Power Flow Systems aircraft exhaust system upgrade improves flights and increases fuel efficiency. Shop Now »uAvionix ADS-B FAA's ADS-B Mandate for 2020 does not have to break the bank, not with the items from uAvionix! See What's New thank you for visiting emapaHere at EMAPA, Aircraft Engine Monitors and Performance Accessories, we are passionate about aviation. Our goal is to provide the best Aircraft engine monitors, performance accessories, modifications, gauges and avionics at the best prices for our clients. For a price match or questions for a General Aviation A&P, please contact us today! Phone: 512-392-7035 • Email us at [email protected] • 1815 Airport Dr San Marcos, Texas at the KHYI Airport 
|
|